Leave a Message

Thank you for your message. We will be in touch with you shortly.

Southland / Prospect / Central Park

Neighborhood Report

main

ABOUT THE NEIGHBORHOOD

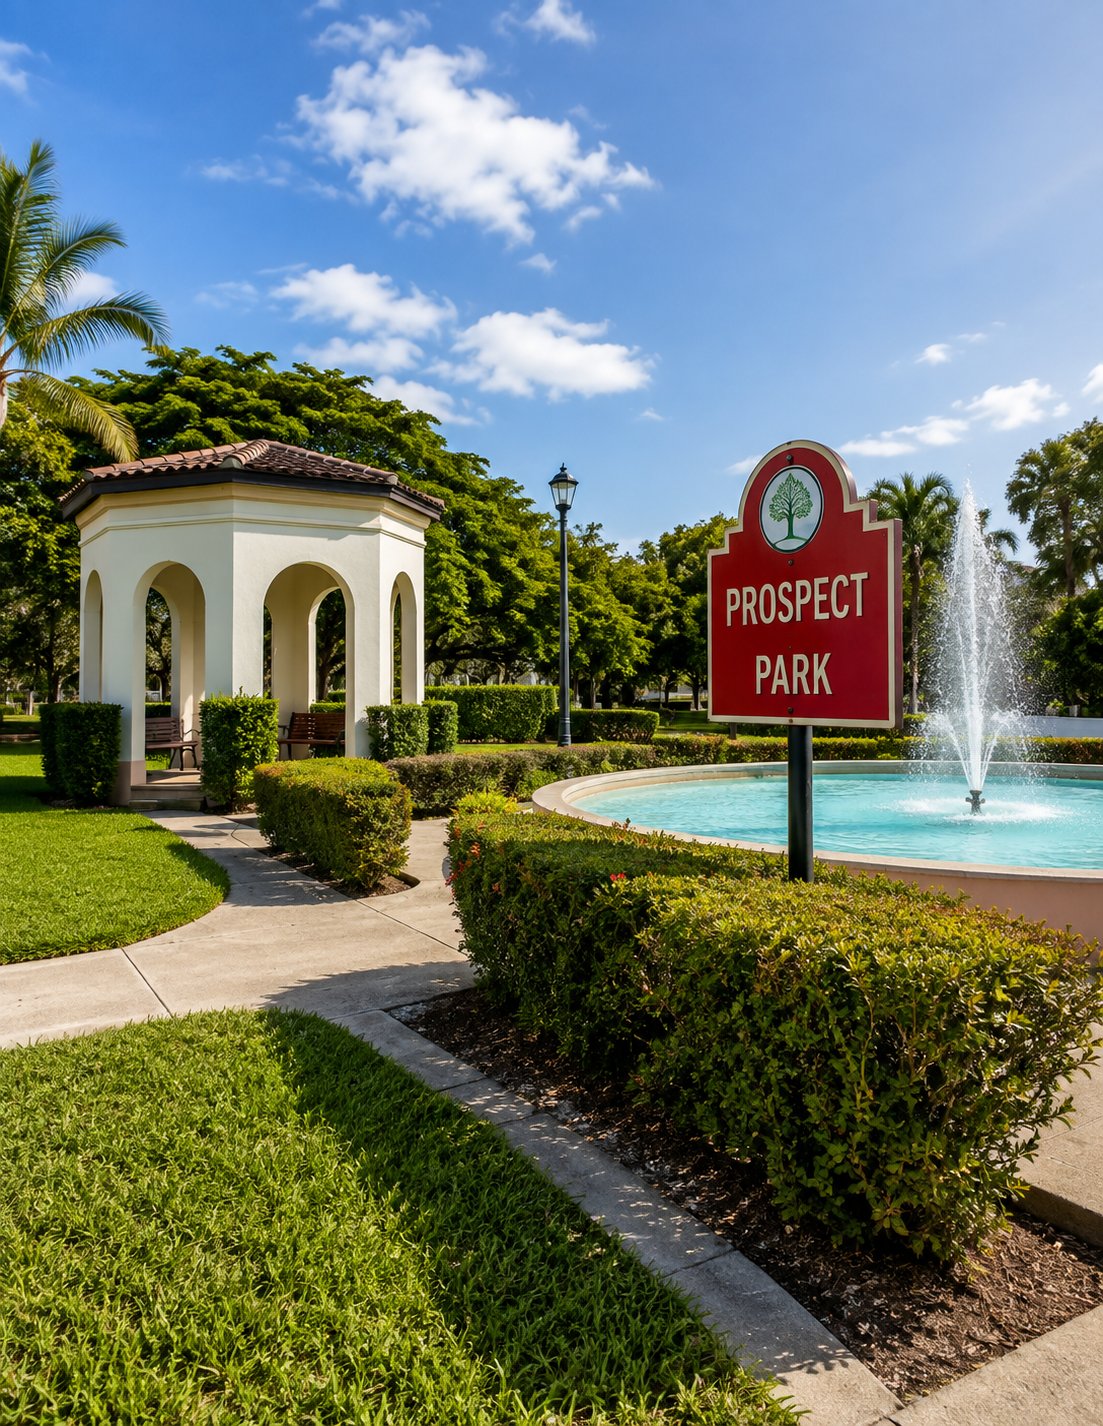
Southland, Prospect Park, and Central Park offer a charming mix of historic character, waterfront access, and distinctive homes. With tree-lined streets, convenient access to downtown, nearby beaches, parks, dining, and shopping, the area offers an appealing South Florida lifestyle for residents and buyers alike.

Market Overview

Southland / Prospect / Central Park currently has 15 active single-family listings with a median asking price of $3,750,000. Over the past 6 months, 23 homes have closed at a median sale price of $2,300,000. At the current absorption rate of 3.8 sales per month, existing inventory represents approximately 3.9 months of supply. The median sale-to-list price ratio is 93.4%.

15
Active Listings
23
6-Mo Closed
3
Pending / Contingent
3.9
Months of Inv.
$2.3M
Median SP
93.4%
SP/LP Ratio

Supply vs. Demand Snapshot

With 3.9 months of inventory, this market currently leans slightly toward sellers. A balanced market typically sits between 4 and 6 months. The 3 pending and contingent listings indicate ongoing transaction activity, with a median pending/contingent list price of $2,700,000.

Metric

Active Listings

Closed Sales (6 Mo)

Spread

Median Price

$3,750,000

$2,300,000

63.0%

Median $/SF

$1,326

$970

36.7%

Median DOM

151.0

91.0

N/A

Price Band Analysis

Under $2M

This segment has 5 active listings, 0 new listings, 1 pending sales, and 8 closed sales in the current 6-month snapshot. Months of inventory stands at 3.8, inventory trend is Falling, and the market is seller-leaning. Average DOM is 75.0, median DOM is 15.5, median sale price is $1,475,000, average sale price is $1,490,006, and median sold $/SF is $925. Recent closed sales activity includes 1 sale(s) in roughly the last 45 days.

$2M - $5M

This segment has 4 active listings, 0 new listings, 2 pending sales, and 11 closed sales in the current 6-month snapshot. Months of inventory stands at 2.2, inventory trend is Falling, and the market is seller-leaning. Average DOM is 142.9, median DOM is 92.0, median sale price is $2,525,000, average sale price is $2,779,182, and median sold $/SF is $1,001. Recent closed sales activity includes 2 sale(s) in roughly the last 45 days.

$5M - $9M

This segment has 4 active listings, 0 new listings, 0 pending sales, and 3 closed sales in the current 6-month snapshot. Months of inventory stands at 8.0, inventory trend is Stable, and the market is buyer-leaning. Average DOM is 84.0, median DOM is 59.0, median sale price is $5,845,000, average sale price is $5,631,667, and median sold $/SF is $1,385. Recent closed sales activity includes 0 sale(s) in roughly the last 45 days.

$9M+

This segment has 2 active listings, 0 new listings, 0 pending sales, and 1 closed sales in the current 6-month snapshot. Months of inventory stands at 12.0, inventory trend is Stable, and the market is buyer-leaning. Average DOM is 238.0, median DOM is 238.0, median sale price is $10,510,000, average sale price is $10,510,000, and median sold $/SF is $2,183. Recent closed sales activity includes 0 sale(s) in roughly the last 45 days.
Band Comparison Summary

Price Band

Active

New

Pend.

Closed

Inv. (Mo)

Market Trend

Avg DOM

Med DOM

Med. SP

Avg. SP

Med.$/SF

SP/LP

Under $2M

5

0

1

8

3.8

Falling

75.0

15.5

$1,475,000

$1,490,006

$925

94.8%

$2M – $5M

4

0

2

11

2.2

Falling

131.0

92.0

$2,525,000

$2,779,182

$1,001

93.5%

$5M – $9M

4

0

0

3

8.0

Stable

84.0

59.0

$5,845,000

$5,631,667

$1,385

90.0%

$9M+

2

0

0

1

12.0

Stable

238.0

238.0

$10,510,000

$10,510,000

$2,183

91.6%

The strongest-performing segment is $2M-$5M because it has the lowest months of inventory at 2.2. The weakest-performing segment is $9M+ at 12.0 months of inventory; transaction volume in that tier is also relatively thin, so individual sales can materially affect the statistics.

Lot Size Analysis

This section segments the market by lot size to show how land size is influencing both current asking prices and recent closed pricing. Larger lots generally command higher absolute pricing, while smaller and medium lots account for most transaction activity.

Lot Size

Active

Closed

Median LP

Median SP

Closed SP/SF

0–6,000 sf

2

3

$1,244,500

$1,325,000

$773

6,001–10,000 sq ft

9

16

$3,475,000

$2,323,000

$956

10,000+ sq ft

4

4

$8,087,500

$5,125,000

$1,391

Additional Closed Metrics

Recent closed sales show a median DOM of 91.0, with a highest sale price of $10,510,000 and a lowest sale price of $719,000. SP$/SF was recalculated directly from sale price divided by living area for each closed property before taking medians within each category.

Home Size Analysis

Breaking the market by living area highlights where buyer demand is concentrating and how efficiently different home sizes are trading.

Home Size

Active

Closed

Median LP

Median SP

Median SP/SF

0–2,000 sq ft

4

8

$1,575,000

$1,475,000

$932

2,001–3,500 sq ft

6

10

$4,272,500

$2,435,500

$928

3,501–5,000 sq ft

4

5

$5,625,000

$5,845,000

$1,385

5,000+ sq ft

1

0

$33,500,000

N/A

N/A

Active DOM Tiers

• 0–30 days: 0 active listings.

• 31–90 days: 5 active listings.

• 90+ days: 10 active listings.

SP per SF Distribution

Band

Closed Sales

Under $600

1 (4%)

$600 - $799

3 (13%)

$800 - $949

7 (30%)

$950 - $1,224

6 (26%)

$1,225+

6 (26%)

The $800 - $949 range is the most common price tier in the current closed-sale distribution.

Key Insights

Market Positioning

At 3.9 months of supply, the overall market remains just below the traditional 4 to 6 month balanced range, indicating modest seller leverage overall.

Strongest Price Segment

$2M-$5M is currently the strongest segment based on the lowest months of supply at 2.2 months.

Weakest Price Segment

$9M+ has the highest months of supply at 12.0 months. Limited transaction volume in this tier can make the statistics more sensitive to individual listings and sales.

Buyer vs. Seller Leverage

Lower-inventory price bands remain more favorable to sellers, while buyers have greater negotiating leverage in higher-supply upper-price segments.

Inventory Conditions

There are 15 active listings, and 10 have been on the market for more than 90 days, indicating that a meaningful share of inventory is taking longer to absorb.

Pricing Trends and Velocity

The median closed sale price is $2,300,000 and the median sale-to-list ratio is 93.4%. Market velocity is strongest in the lower-supply segments, while higher-end inventory generally requires more time and precise pricing.

Buyer and Seller Considerations

Buyers should focus negotiating efforts on listings with extended market time and higher-supply price bands. Sellers should position properties closely to recent comparable sales and account for the slower pace of older inventory