Neighborhood Report
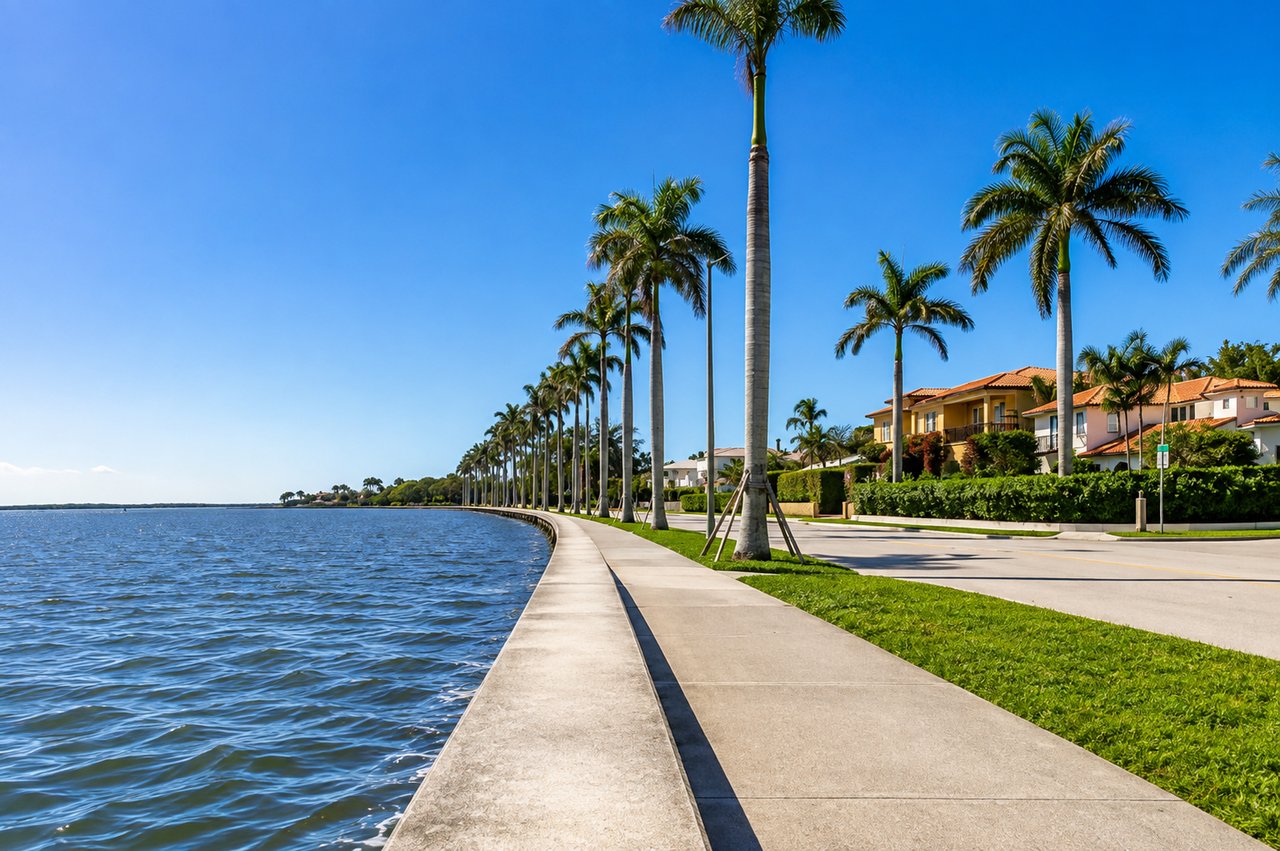
El Cid is one of West Palm Beach's most distinctive historic neighborhoods, known for its Mediterranean Revival architecture, waterfront setting, and tree-lined streets. Located just south of downtown, El Cid offers a unique blend of historic character, walkable surroundings, and easy access to the Intracoastal, Palm Beach Island, and the city's dining, shopping, and cultural attractions.
El Cid currently has 9 active single-family listings with a median asking price of $5,950,000. Over the past 6 months, 9 homes have closed at a median sale price of $3,300,000. At the current absorption rate of 1.5
With 6.0 months of inventory, El Cid sits in balanced conditions. The 4 pending listings suggest continuing transaction activity, with a median pending list price of $5,897,000. Active pricing remains materially above recent closed pricing, reinforcing the importance of property-level positioning, condition, and waterfront exposure.
Metric | Active Listings | Closed Sales (6 Mo) | Spread |
|---|---|---|---|
Median Price | $5,950,000 | $3,300,000 | 80.3% |
Median $/SF | $1,390 | $1,293 | 7.5% |
Median DOM | 179.0 | 185.0 | N/A |
This segment has 0 active listings, 0 new listings, 1 pending/contingent listings, and 2 closed sales in the current 6-month snapshot. Months of supply is 0.0, reflecting tight inventory conditions. Closed sales show an average DOM of 152.5 and a median DOM of 152.5. Median sale price is $2,165,000, average sale price is $2,165,000, median sold $/SF is $988, and the median sale-to-list ratio is 87.7%.
This segment has 2 active listings, 0 new listings, 0 pending/contingent listings, and 6 closed sales in the current 6-month snapshot. Months of supply is 2.0, reflecting tight inventory conditions. Closed sales show an average DOM of 242.3 and a median DOM of 171.5. Median sale price is $3,450,000, average sale price is $3,591,667, median sold $/SF is $1,348, and the median sale-to-list ratio is 93.7%.
This segment has 7 active listings, 0 new listings, 3 pending/contingent listings, and 1 closed sales in the current 6-month snapshot. Months of supply is 42.0, reflecting buyer inventory conditions. Closed sales show an average DOM of 185.0 and a median DOM of 185.0. Median sale price is $6,000,000, average sale price is $6,000,000, median sold $/SF is $1,327, and the median sale-to-list ratio is 87.1%.
Price Band | Active | New | Pend. | Closed | Inv. (Mo) | Market Trend | Avg DOM | Med DOM | Med. SP | Avg. SP | Med.$/SF | SP/LP |
|---|---|---|---|---|---|---|---|---|---|---|---|---|
Under $3M | 0 | 0 | 1 | 2 | 0.0 | Tight | 152.5 | 152.5 | $2,165,000 | $2,165,000 | $988 | 87.7% |
$3M-$5M | 2 | 0 | 0 | 6 | 2.0 | Tight | 242.3 | 171.5 | $3,450,000 | $3,591,667 | $1,348 | 93.7% |
Above $5M | 7 | 0 | 3 | 1 | 42.0 | Buyer | 185.0 | 185.0 | $6,000,000 | $6,000,000 | $1,327 | 87.1% |
$3M-$5M has the greatest recent transaction depth, while Above $5M carries the highest months of supply in the current six-month window. Overall absorption is 1.5 sales per month. Segment-level supply remains especially important in El Cid because a small number of high-value sales can materially influence headline statistics.
This section segments the market by lot size to show how land size is influencing both current asking prices and recent closed pricing across El Cid.
Lot Size | Active | Closed | Median LP | Median SP | Closed SP/SF |
|---|---|---|---|---|---|
0–6,000 sf | 0 | 0 | N/A | N/A | N/A |
6,001–10,000 sq ft | 4 | 8 | $4,647,500 | $3,275,000 | $1,254 |
10,000+ sq ft | 4 | 1 | $6,447,500 | $6,000,000 | $1,327 |
Recent closed sales show a median DOM of 185.0, with a highest sale price of $6,000,000 and a lowest sale price of $1,680,000. SP$/SF was recalculated directly from sale price divided by living area for each closed property before taking medians within each category.
Lot size is only one pricing variable in El Cid. Renovation quality, architectural character, waterfront position, new-construction status, and overall design can create substantial pricing differences even among similarly sized parcels.
Breaking the market by living area highlights where buyer demand is concentrating and how efficiently different home sizes are trading across El Cid.
Home Size | Active | Closed | Median LP | Median SP | Median SP/SF |
|---|---|---|---|---|---|
Under 2,500 sq ft | 1 | 3 | $6,795,000 | $3,250,000 | $1,402 |
2,500-4,000 sq ft | 4 | 5 | $4,647,500 | $3,600,000 | $1,215 |
4,000+ sq ft | 4 | 1 | $6,025,000 | $6,000,000 | $1,327 |
Buyer demand remains most measurable in the home-size categories with the greatest transaction depth. Larger homes can command higher absolute prices, but pricing power depends heavily on design, condition, lot quality, waterfront exposure, and renovation level.
• 0–30 days: 0 active listings.
• 31–90 days: 3 active listings.
• 90+ days: 6 active listings.
Band | Closed Sales |
|---|---|
Under $500 | 0 (0%) |
$500 - $749 | 0 (0%) |
$750 - $999 | 2 (22%) |
$1,000 - $1,249 | 2 (22%) |
$1,250 - $1,499 | 3 (33%) |
$1,500+ | 2 (22%) |
The most common price-per-square-foot tiers in the refreshed six-month dataset are $1,250 - $1,499. The overall median closed price per square foot is $1,293. In El Cid, waterfront position, new construction, architectural pedigree, and renovation quality can create large $/SF dispersion.
With 6.0 months of inventory, El Cid currently sits in balanced conditions.
$3M-$5M has the greatest recent transaction depth, with 6 closed sales in the six-month reporting window.
Above $5M currently has 7 active listings and 3 pending listings, with 1 closed sale in the six-month window, creating the greatest buyer leverage.
Lower-supply tiers favor sellers more strongly, while the upper end currently offers buyers more negotiating room because active asking inventory substantially exceeds recent closed-sale depth.
There are 9 active listings, and 6 have been on market more than 90 days. Median active DOM is 179.0. Conditions vary meaningfully by price tier and property type.
Overall sales pace is 1.5 closings per month, with a median six-month sale price of $3,300,000 and median sold $/SF of $1,293.
Buyers should focus on aged listings and the higher-supply price tiers; sellers should price against recent absorption and closed-sale evidence rather than relying only on active asking prices.