Neighborhood Report
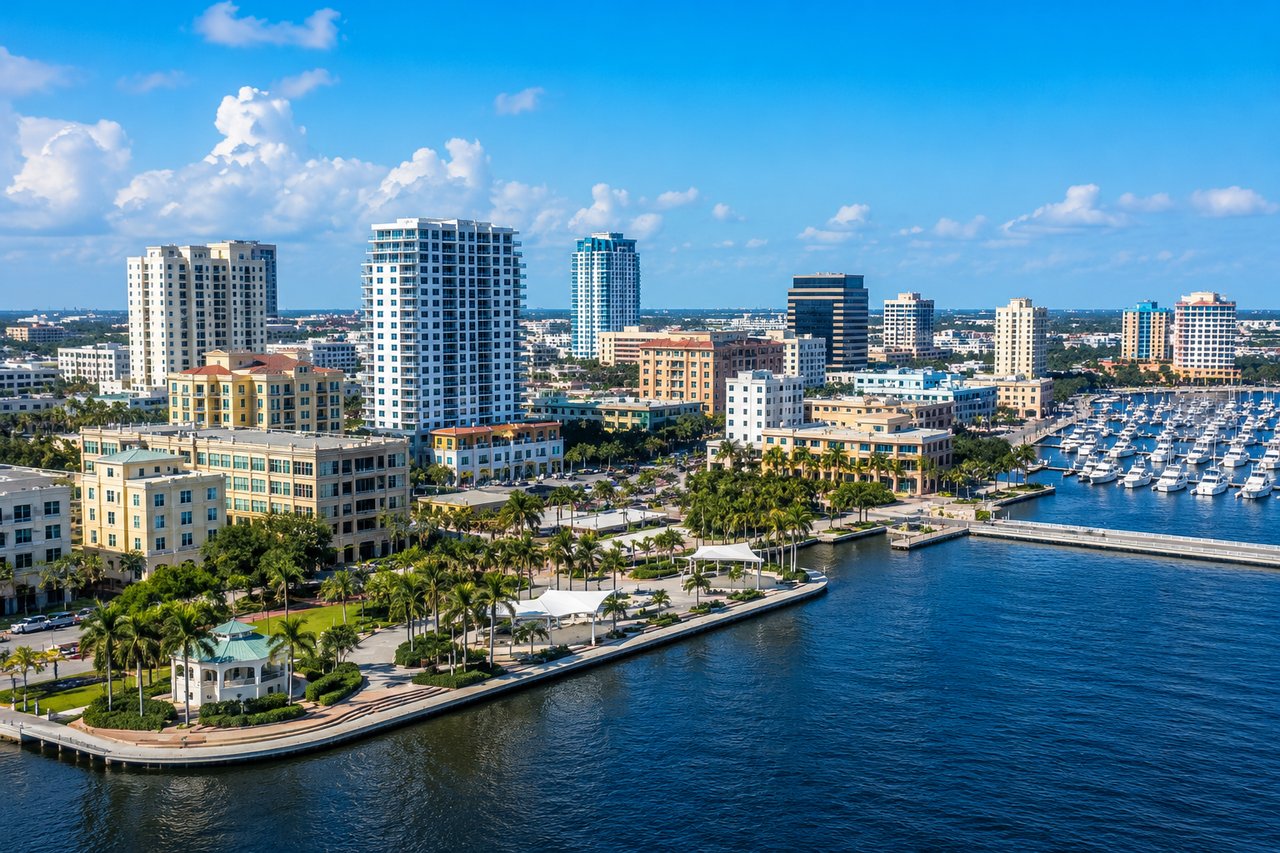
Downtown West Palm Beach offers a vibrant mix of urban living, waterfront access, dining, shopping, and entertainment. The area features a variety of residential properties, from established homes in surrounding neighborhoods to luxury residences near the heart of downtown. Residents enjoy convenient access to Clematis Street, the waterfront, Palm Beach Island, parks, restaurants, and cultural attractions, making Downtown West Palm Beach an appealing choice for buyers seeking a connected South Florida lifestyle.
Downtown West Palm Beach currently has 38 active single-family listings with a median asking price of $2,322,500. Over the past 6 months, 62 homes have closed at a median sale price of $2,006,775. At the current absorption rate of 10.3 sales per month, existing inventory represents approximately 3.7 months of supply, indicating a market that is seller-leaning. The median sale-to-list price ratio is 93.1%.
With 3.7 months of inventory, this market is currently seller-leaning. Active median pricing of $2,322,500 sits above the recent closed median of $2,006,775, while active median LP$/SF of $1,236 compares with a closed median SP$/SF of $928. Median active DOM is 104.5 versus 77.5 for closed sales, and the 14 pending or contingent listings point to ongoing buyer engagement near a median pending price of $2,249,500.
Active Listings | Closed Sales (6 Mo) | Spread | |
|---|---|---|---|
Median Price | $2,322,500 | $2,006,775 | 15.7% |
Median $/SF | $1,236 | $928 | 33.2% |
Median DOM | 104.5 | 77.5 | N/A |
Under $2M currently shows 18 active listings, 3 new listings, 6 pending sales, and 31 closed sales. Months of supply stands at 3.5; inventory is declining. Median closed price is $1,325,000, median sold $/SF is $759, median DOM is 20.0, and median SP/LP is 95.7%.
$2M - $5M currently shows 9 active listings, 1 new listings, 5 pending sales, and 27 closed sales. Months of supply stands at 2.0; inventory is stable. Median closed price is $2,850,000, median sold $/SF is $1,135, median DOM is 103.0, and median SP/LP is 92.6%.
$5M - $9M currently shows 8 active listings, 0 new listings, 3 pending sales, and 3 closed sales. Months of supply stands at 16.0; inventory is declining. Median closed price is $5,845,000, median sold $/SF is $1,385, median DOM is 59.0, and median SP/LP is 90.0%.
$9M+ currently shows 3 active listings, 0 new listings, 0 pending sales, and 1 closed sales. Months of supply stands at 18.0; inventory is stable. Median closed price is $10,510,000, median sold $/SF is $2,183, median DOM is 238.0, and median SP/LP is 91.6%.
Price Band | Active | New | Pend. | Closed | Inv. (Mo) | Inventory Trend | Avg DOM | Med DOM | Med. SP | Avg. SP | Med.$/SF | SP/LP |
|---|---|---|---|---|---|---|---|---|---|---|---|---|
Under $2M | 18 | 3 | 6 | 31 | 3.5 | Declining | 68.4 | 20.0 | $1,325,000 | $1,267,066 | $759 | 95.7% |
$2M – $5M | 9 | 1 | 5 | 27 | 2.0 | Stable | 143.0 | 103.0 | $2,850,000 | $2,918,025 | $1,135 | 92.6% |
$5M – $9M | 8 | 0 | 3 | 3 | 16.0 | Declining | 84.0 | 59.0 | $5,845,000 | $5,631,667 | $1,385 | 90.0% |
$9M+ | 3 | 0 | 0 | 1 | 18.0 | Stable | 238.0 | 238.0 | $10,510,000 | $10,510,000 | $2,183 | 91.6% |
$2M - $5M is the strongest-performing segment based on absorption and transaction activity. $9M+ is the weakest segment, where higher supply and slower velocity give buyers more leverage.
This section segments the market by lot size to show how land size is influencing both current asking prices and recent closed pricing. Larger lots continue to command materially higher pricing, while smaller and medium lots account for much of current inventory and transaction activity.
Lot Size | Active | Closed | Median LP | Median SP | Closed SP/SF |
|---|---|---|---|---|---|
0–6,000 sf | 5 | 10 | $1,100,000 | $1,032,500 | $800 |
6,001–10,000 sq ft | 25 | 44 | $1,900,000 | $2,100,000 | $945 |
10,000+ sq ft | 8 | 8 | $6,447,500 | $3,110,842 | $1,103 |
Recent closed sales show a median DOM of 77.5, with a highest sale price of $10,510,000 and a lowest sale price of $525,000.
Breaking the market by living area highlights where buyer demand is concentrating and how efficiently different home sizes are trading.
Home Size | Active | Closed | Median LP | Median SP | Median SP/SF |
|---|---|---|---|---|---|
0–2,000 sq ft | 16 | 26 | $1,472,500 | $1,262,500 | $852 |
2,001–3,500 sq ft | 12 | 29 | $3,612,500 | $2,525,000 | $944 |
3,501–5,000 sq ft | 7 | 7 | $5,950,000 | $5,050,000 | $1,327 |
5,000+ sq ft | 2 | 0 | $27,700,000 | N/A | N/A |
• 0–30 days: 8 active listings.
• 31–90 days: 9 active listings.
• 90+ days: 21 active listings.
Band | Closed Sales |
|---|---|
Under $500 | 4 (6%) |
$500 - $749 | 14 (23%) |
$750 - $999 | 20 (32%) |
$1,000 - $1,249 | 11 (18%) |
$1,250 - $1,499 | 7 (11%) |
$1,500+ | 6 (10%) |
The $750 - $999 range is the most common price tier, representing 32% of all closed sales.
With 3.7 months of inventory, Downtown West Palm Beach is currently seller-leaning.
$2M - $5M is the strongest segment.
$9M+ is the weakest segment.
The overall median SP/LP ratio is 93.1%.
Current inventory totals 38 active listings against 62 closed sales over the past 6 months, producing an absorption rate of 10.3 sales per month.
Active median pricing of $2,322,500 remains above the closed median of $2,006,775.